Most kiosk purchasing decisions hinge on a single number, the hardware price, but that figure is only a fraction of the kiosk total cost of ownership. For the teams who actually live with a deployment: IT, procurement, and the executives who sign off on uptime commitments, the decisions that determine total cost and reliability happen after the purchase order and over years of operation. This guide explains how to think about that span of time, what downtime really costs, and why lifecycle ownership has become the dominant model for organizations that can’t afford to go offline.
What is lifecycle ownership?
Lifecycle ownership is the practice of managing a deployed asset across its entire operational life. This spans from installation through steady-state operation, component aging, and end-of-life refresh, rather than treating the transaction as finished at the moment of purchase. It considers the parts, people, processes, and response capabilities that keep an asset productive for the full duration it’s in service.
A warranty is not lifecycle ownership. A warranty is a backward-looking promise about manufacturing defects, usually fulfilled on the vendor’s timeline.
Lifecycle ownership is a forward-looking commitment to keep the asset running on the operator’s timeline. The distinction matters because a kiosk does not exist to be defect-free; it exists to complete transactions, check in patients, or process travelers. The relevant question is never “was this built correctly?” but “is it working right now, and how fast can we recover when it isn’t?”
A self-service kiosk passes through four broad stages in its life: deployment and integration, steady-state operation, component aging and increasing failure rates, and end-of-life refresh or replacement. Each stage carries its own costs and risks. Lifecycle ownership is the discipline of planning for all four before the first unit ships, rather than making it up as you go.
How much does kiosk downtime actually cost?
Downtime cost falls into three categories, and most organizations only measure the first.
Lost revenue. Every hour a transaction-generating kiosk is offline is a transaction that doesn’t happen–a sale not made, a payment not collected, a fee not processed. For revenue-facing deployments this is the most visible cost and the easiest to model.
Operational disruption. When self-service fails, the work doesn’t disappear; it falls back onto staff. Queues form, employees are reassigned to run manual workarounds, throughput drops, and the workarounds themselves introduce errors. This cost is real but rarely tracked, because it shows up as a labor strain rather than a line item.
Compliance and safety exposure. In healthcare, transit, and government deployments, a downed kiosk can mean a missed check-in, a safety gap, or a breach of a contractual uptime requirement. Where an SLA promises 99%-plus availability, downtime converts directly into penalty exposure and reputational risk with the contracting agency.
You can estimate your own exposure with a straightforward calculation:
Downtime cost per hour = (transactions per hour × value per transaction) + (diverted labor cost per hour) + (downstream and penalty costs per hour)
Run that number against a realistic recovery time and the result is often sobering. A single component failure that takes weeks to resolve under a reactive model can cost many multiples of the part itself. And the calculation above still understates the total, because it omits the second-order costs that are hardest to recover: customers who abandon the queue and don’t return, the reputational hit from visibly broken machines, and the cascading backlogs that build in high-throughput environments where minutes of downtime create hours of recovery.
The iceberg: total cost of ownership
Total cost of ownership (TCO) is the full cost of an asset across its operational life, of which the purchase price is only the visible tip. Below the waterline sit integration and deployment, support contracts, replacement parts, repair labor and logistics, the cost of downtime itself, preventative maintenance, and eventual refresh or disposal. Over a three-to-five-year deployment, acquisition cost is frequently a small part of the total.
This is why the cheapest hardware can end up being the most expensive deployment an organization owns. A unit with a lower sticker price often fails more frequently, takes longer to repair, and has no reliable parts pipeline behind it. Each of those drives up the hidden costs below the waterline, and because the failures are unpredictable, so are the costs, which makes them hard to budget for. By choosing the lowest purchase price, procurement teams often end up with much higher costs everywhere else and these are the costs that don’t appear on the quote but show up later as downtime and repairs. The discipline TCO demands is simple to state and hard to practice: evaluate the cost of the deployment over its life, not the cost of the box on the dock.
Reactive versus proactive: two models of lifecycle management
There are two fundamentally different ways to manage a fleet over its lifecycle, and they produce very different cost and uptime outcomes.
The reactive, or break-fix, model waits for a failure, then begins a sequence: diagnose the problem, locate a part, order it, wait for it to ship, schedule a repair, and execute it. Each step adds time, the part may sit in a distant depot, and the operator typically bears the coordination burden. The result is long recovery times, unpredictable per-incident costs, and downtime measured in weeks rather than days.
The proactive, or managed-lifecycle, model inverts the sequence. Spare parts are pre-positioned in proportion to the deployed fleet. Replacements are shipped in advance, so a working component is in hand before the failed one is even returned. Field response is defined and committed. Preventative maintenance reduces the failure rate in the first place, and monitoring catches issues before they become outages. The result is short, predictable recovery and a cost structure that can actually be budgeted.
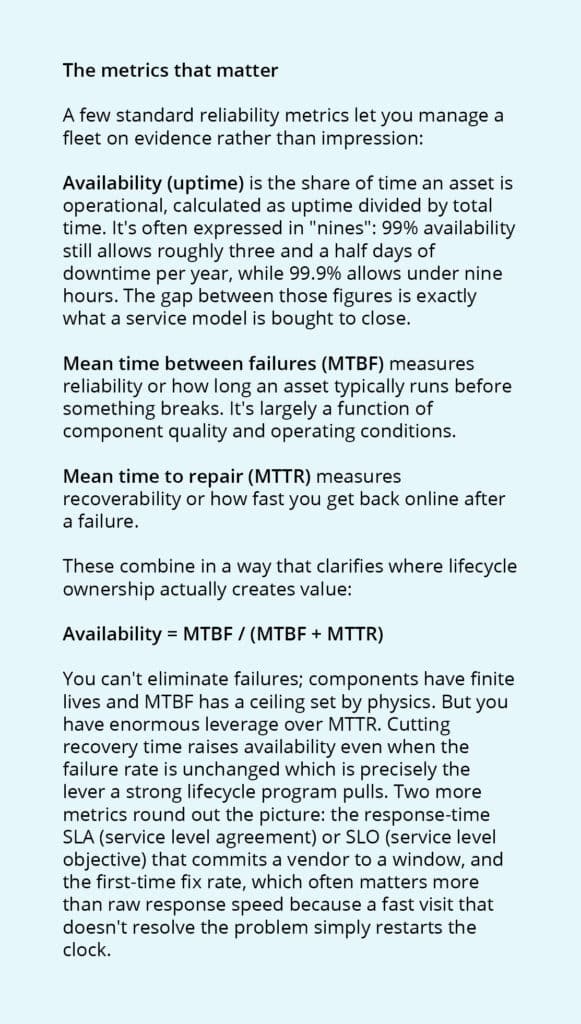
The single number that separates these models is mean time to repair (MTTR) — how long, on average, it takes to restore a failed asset. The difference between a part that takes a month to cycle through a depot and one that arrives in a couple of days is not a small efficiency gain; multiplied by the downtime cost per day calculated above, it is often the largest controllable variable in the entire TCO equation.
What good lifecycle ownership looks like in practice
A mature lifecycle program tends to share the same components, regardless of vendor:
• Proportional parts stocking. Replacement inventory sized to the deployed fleet, so the right components are on hand when they’re needed rather than ordered after a failure.
Advance replacement. A working part shipped before the defective one is returned, collapsing recovery time from weeks to days.
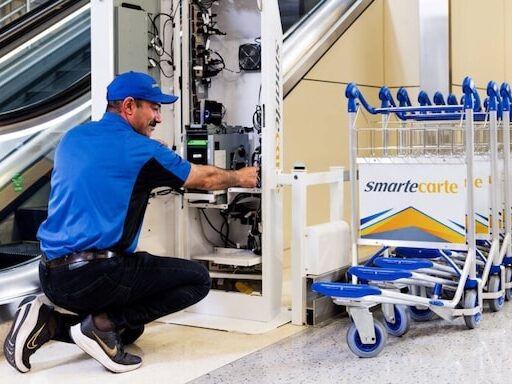
• Defined field response. Qualified technicians dispatched to the site within a committed window, removing the coordination burden from the operator’s team.
Preventative maintenance. Scheduled inspections, cleanings, and component refreshes that extend asset life and reduce the rate of unplanned failure and addresses the MTBF side of the equation rather than only the MTTR side.
• Proactive monitoring and self-healing. Remote visibility into application, firmware, power, and security status that detects issues, and in advanced systems, resolves common software, network, and power faults automatically before a ticket is ever raised.
• Coverage matched to the deployment’s life. Multi-year terms aligned to the three-to-five-year operating life of the fleet, replacing year-to-year uncertainty with a planned, budgeted commitment.
At Olea, this is how we think about a deployment from the outset: hardware, deployment, kiosk service and support, and lifecycle ownership treated as one managed solution rather than a product followed by a scramble. But the framework above is vendor-agnostic and any serious operator should expect these capabilities from whoever maintains their fleet.
Right-sizing coverage to your operation
Lifecycle coverage should be configured around how a fleet actually operates, not sold as a single package. Four variables drive the right level of coverage:
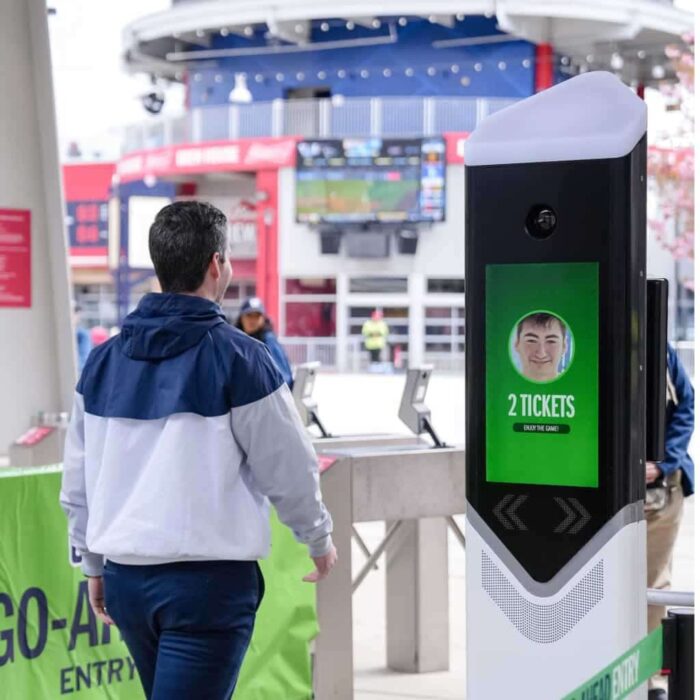
Operational hours — a 24/7 healthcare check-in network, a stadium with concentrated event windows, and an airport running first-flight to last-flight all need support availability matched to when downtime actually hurts.
Geography — a single-site campus and a fleet spread across two hundred locations require very different dispatch capacity and parts distribution.
Volume — stocking levels, turnaround commitments, and dedicated support scale with deployed count.
Criticality — the higher the stakes, whether revenue, patient safety, or public transit, the less tolerance there is for any gap in coverage.
The same framework lands differently by sector. A healthcare patient check-in network treats a failed card reader as a clinical-flow problem and needs same-day recovery so intake never stops. An airport self-service deployment, running long days every day of the year, treats a downed document or biometric scanner as a cascading-backlog problem measured in minutes. A statewide DMV deployment operating under a contractual uptime requirement treats downtime as a compliance-reporting problem, where the vendor must own the outcome and not just the hardware. The variables are constant; the weighting changes.
A checklist: assess your deployment’s downtime risk
Before your next purchase or renewal, your team should be able to answer:
- What does one hour of downtime cost us, across revenue, labor, and compliance?
- What is our current mean time to repair when a component fails and is it days, or weeks?
- Are replacement parts pre-positioned for our fleet, or sourced after a failure?
- Who coordinates a repair when a unit goes down, our team, or the vendor’s?
- Do we have a committed response window, or a best-effort promise?
- Does our coverage term match the years we expect to operate these units?
- Are we modeling total cost of ownership, or just comparing purchase prices?
If the answers are uncertain, the deployment is carrying more risk than its budget reflects.
FAQs
What is the difference between a warranty and lifecycle ownership? A warranty covers manufacturing defects on the vendor’s timeline. Lifecycle ownership is a commitment to keep the asset operational on the operator’s timeline, covering parts, response, maintenance, and recovery across the asset’s full service life.
How do you calculate the cost of kiosk downtime? Multiply transactions per hour by value per transaction to capture lost revenue, add the cost of diverted labor and manual workarounds, and add any downstream or contractual penalty costs. The full figure also includes harder-to-measure losses such as customer abandonment and reputational impact.
Why can the cheapest kiosk be the most expensive choice? Purchase price is a minority of total cost of ownership over a three-to-five-year life. Lower-priced hardware that fails more often, takes longer to repair, and lacks a parts pipeline so it accumulates unpredictable cost across every other dimension.
What is advance replacement? A model in which a working replacement component is shipped before the failed part is returned, reducing recovery time from weeks under a depot-return model to a small number of days.
What’s the most important reliability metric to manage? Mean time to repair (MTTR) is usually the largest controllable variable. Failures are inevitable, but cutting recovery time raises availability directly, even when the failure rate is unchanged.
How long should kiosk support coverage last? Coverage should match the expected operating life of the deployment, typically three to five years, so the commitment spans the full period the fleet is in service rather than renewing on uncertain annual terms.
The bottom line
Uptime is not a hardware specification; it is an ownership decision. The price on the purchase order is real, but it is the smallest and most visible part of what a deployment will cost over its life. The organizations that run self-service successfully are the ones that treat the kiosk as an asset to be managed for years, modeling kiosk total cost of ownership, measuring recovery time, and building the parts, response, and maintenance to keep failures from becoming outages.